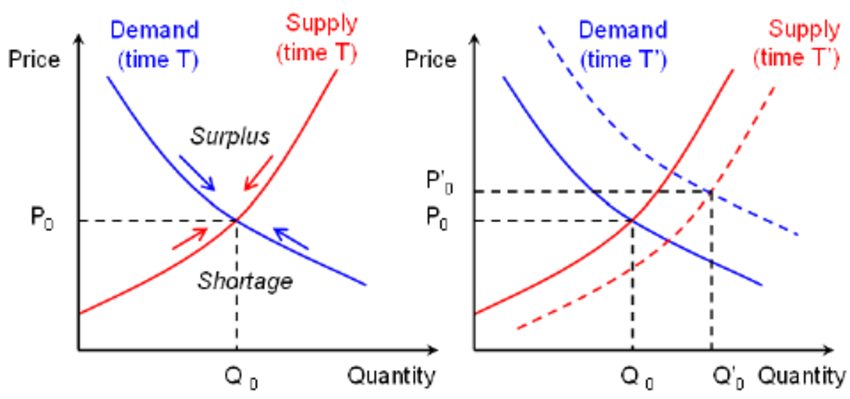
As the diagram on the left shows:
Surplus: The economic surplus “describes the amount of an asset or resource that exceeds the portion that’s actively utilized” (Kenton, 2023). The phenomenon could be explained with an example of more products being produced than the customers’ demand. It always happens in the economic system and results in an unsold situation for the suppliers and the business owners. From the diagram, the surplus is located above the interaction point of the demand and supply slope, with the demand in a downward trend and the supply in an upward trend; reducing both the quantities and the prices may improve this problem.
Shortage: Conversely, the economic shortage “is a condition where the quantity demanded is greater than the quantity supplied at the market price” (Chen, 2022), which means the customers demand more on the products but the quantities are inadequate in the market. As a result, the sellers of the products will be more likely to increase the prices because of the high level of demand. From the diagram, the shortage is located below the interaction point of the demand and supply, with the demand in an upward trend and the supply in a downward trend; increasing both the quantities and the prices may improve this problem.
The diagram on the right describes the relationship among Price, Quantity, Demand, and Supply, a few conclusions are drawn upon it:
- Supply is generally considered to slope upward:
- An increase in supply causes the decrease in price.
- Demand is generally considered to slope downward:
- An increase in demand causes the increase in price.
- As the price increases, supply rises while demand declines. Conversely, as the price drops supply constricts while demand grows.
- If there is a shortage of goods, the quantity demanded exceeds the quantity supplied. If there is a surplus, the quantity supplied exceeds the quantity demanded.
- Supply and demand interact in the market in several ways to determine the market equilibrium.